Ensemble models calculated on multiple models have often been shown to outcompete any single model in comparative assessments (Valavi et al. 2022).
This function creates an ensemble of multiple provided distribution models
fitted with the ibis.iSDM-package. Each model has to have estimated
predictions with a given method and optional uncertainty in form of the
standard deviation or similar. Through the layer parameter it can be
specified which part of the prediction should be averaged in an ensemble.
This can be for instance the mean prediction and/or the standard deviation
sd. See Details below for an overview of the different methods.
Also returns a coefficient of variation (cv) as output of the ensemble, but note this should not be interpreted as measure of model uncertainty as it cannot capture parameter uncertainty of individual models; rather it reflects variation among predictions which can be due to many factors including simply differences in model complexity.
Usage
ensemble(
  ...,
  method = "mean",
  weights = NULL,
  min.value = NULL,
  layer = "mean",
  normalize = FALSE,
  uncertainty = "cv",
  point = NULL,
  field_occurrence = "observed",
  apply_threshold = TRUE
)

# S4 method for class 'ANY'
ensemble(
  ...,
  method = "mean",
  weights = NULL,
  min.value = NULL,
  layer = "mean",
  normalize = FALSE,
  uncertainty = "cv",
  point = NULL,
  field_occurrence = "observed",
  apply_threshold = TRUE
)
Arguments
- ...
Provided
DistributionModelorSpatRasterobjects.- method
Approach on how the ensemble is to be created. See details for available options (Default:
'mean').- weights
(Optional) weights provided to the ensemble function if weighted means are to be constructed (Default:
NULL).- min.value
A optional
numericstating a minimum value that needs to be surpassed in each layer before calculating and ensemble (Default:NULL).- layer
A
characterof the layer to be taken from each prediction (Default:'mean'). If set toNULLignore any of the layer names in ensembles ofSpatRasterobjects.- normalize
logicalon whether the inputs of the ensemble should be normalized to a scale of 0-1 (Default:FALSE).- uncertainty
A
characterindicating how the uncertainty among models should be calculated. Available options include"none", the standard deviation ("sd"), the average of all PCA axes except the first"pca", the coefficient of variation ("cv", Default) or the range between the lowest and highest value ("range").- point
A
sfobject containing observational data used for model training. Used for method'superlearner'only (Default:NULL).- field_occurrence
A
characterlocation of biodiversity point records (Default:'observed').- apply_threshold
A
logicalflag (Default:TRUE) specifying whether threshold values should also be created via"method". Only applies and works forDistributionModeland thresholds found.
Value
A SpatRaster object containing the ensemble of the provided
predictions specified by method and a coefficient of variation
across all models.
Details
Possible options for creating an ensemble includes:
'mean'- Calculates the mean of several predictions.'median'- Calculates the median of several predictions.'max'- The maximum value across predictions.'min'- The minimum value across predictions.'mode'- The mode/modal values as the most commonly occurring value.'weighted.mean'- Calculates a weighted mean. Weights have to be supplied separately (e.g. TSS).'min.sd'- Ensemble created by minimizing the uncertainty among predictions.'threshold.frequency'- Returns an ensemble based on threshold frequency (simple count). Requires thresholds to be computed.'pca'- Calculates a PCA between predictions of each algorithm and then extract the first axis (the one explaining the most variation).'superlearner'- Composites two predictions through a 'meta-model' fitted on top (using aglmby default). Requires binomial data in current Setup.
In addition to the different ensemble methods, a minimal threshold
(min.value) can be set that needs to be surpassed for averaging. By
default this option is not used (Default: NULL).
Note by default only the band in the layer parameter is composited. If
supported by the model other summary statistics from the posterior (e.g.
'sd') can be specified.
Note
If a list is supplied, then it is assumed that each entry in the list
is a fitted DistributionModel object. Take care not to create an ensemble
of models constructed with different link functions, e.g. logistic vs log.
In this case the "normalize" parameter has to be set.
References
Valavi, R., Guillera‐Arroita, G., Lahoz‐Monfort, J. J., & Elith, J. (2022). Predictive performance of presence‐only species distribution models: a benchmark study with reproducible code. Ecological Monographs, 92(1), e01486.
Examples
# Method works for fitted models as well as as rasters
r1 <- terra::rast(nrows = 10, ncols = 10, res = 0.05, xmin = -1.5,
xmax = 1.5, ymin = -1.5, ymax = 1.5, vals = rnorm(3600,mean = .5,sd = .1))
r2 <- terra::rast(nrows = 10, ncols = 10, res = 0.05, xmin = -1.5,
xmax = 1.5, ymin = -1.5, ymax = 1.5, vals = rnorm(3600,mean = .5,sd = .5))
names(r1) <- names(r2) <- "mean"
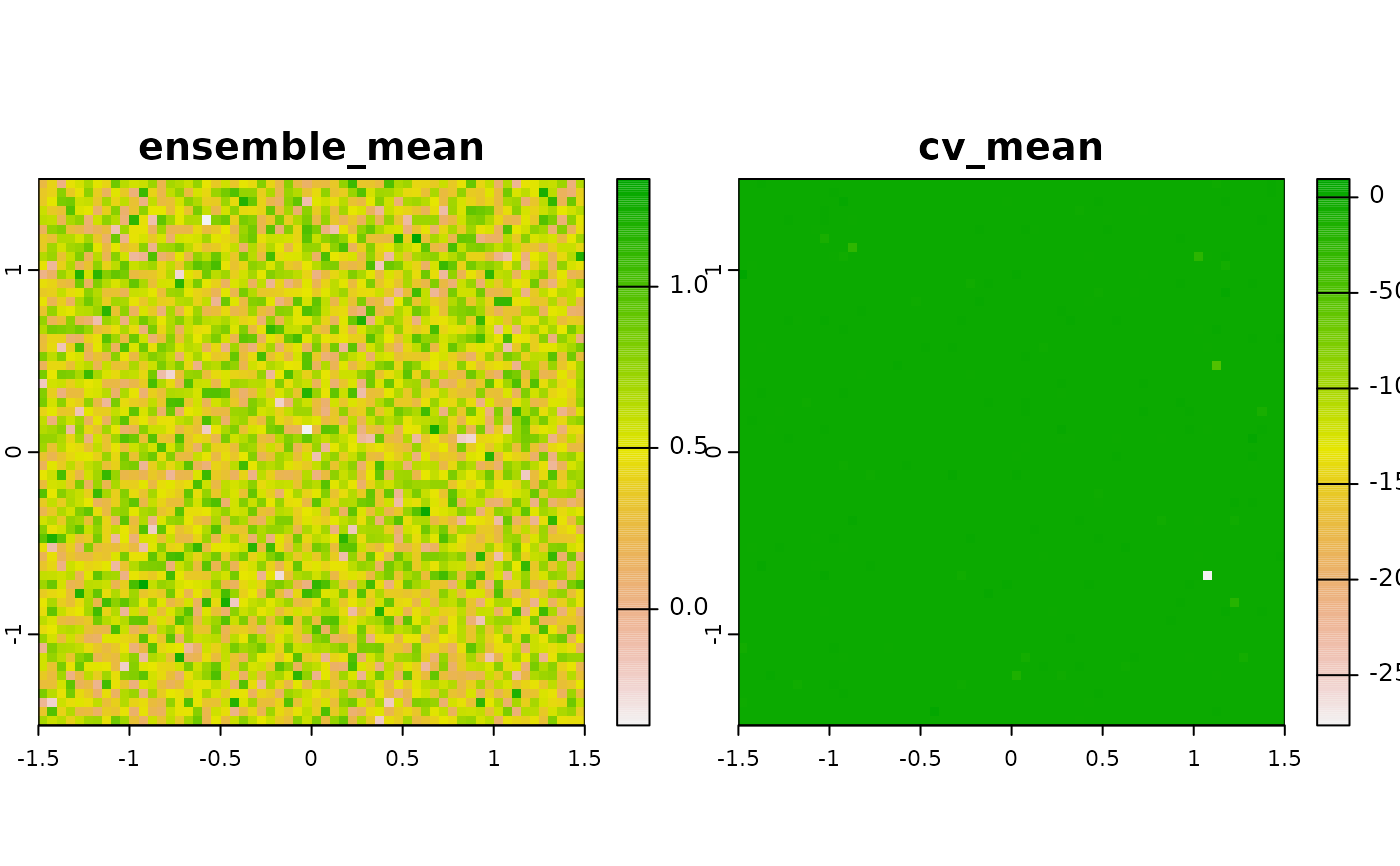
# Assumes previously computed predictions
ex <- ensemble(r1, r2, method = "mean")
terra::plot(ex)